Full Feature Breakdown
ORB Sport Metrics Explained
Seamlessly integrate protection with advanced performance tracking, empowering athletes to train and compete with heightened awareness and insight.
Heart Rate
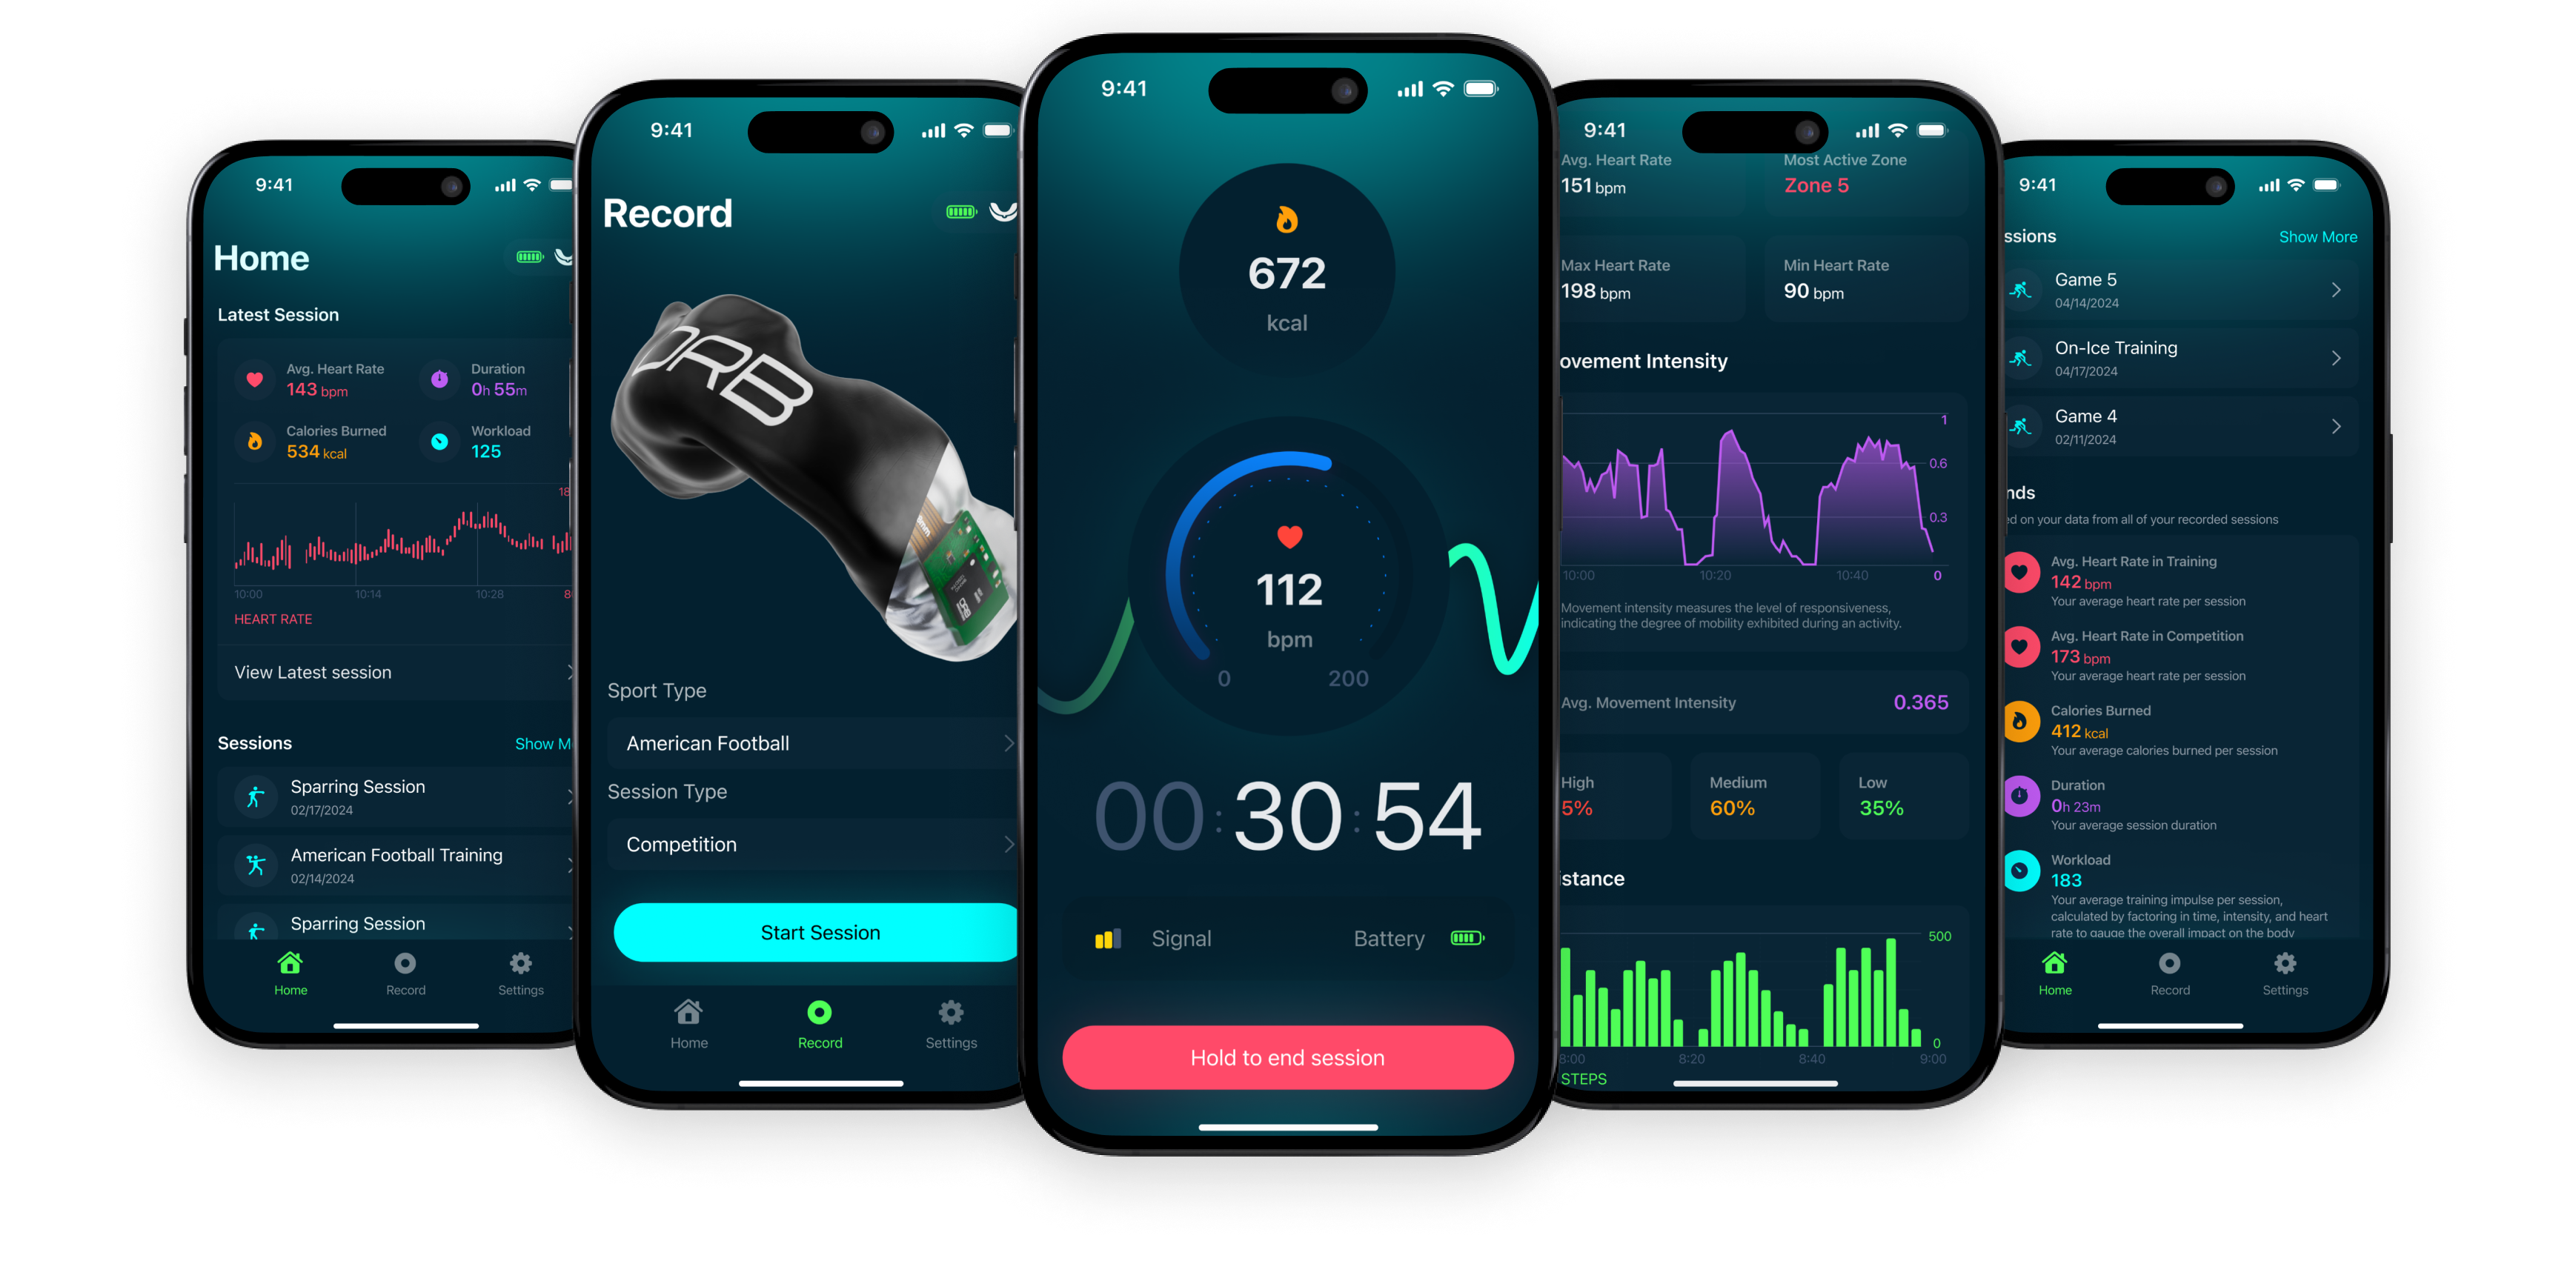
Once a session is recorded, you can view your heart rate and analyze the time spent in each heart rate zone. We also provide key heart rate data, including minimum and maximum rates and your most active zone.
Heart Rate Chart
This graph presents a visual representation of your heart rate throughout the session. It dynamically scales to offer a clear view of how your heart rate responded during various phases of activity. Gaps in the graph may indicate moments when the mouthguard was not recording, such as when it was removed from your mouth.
Heart Rate Zones
This section displays a color-coded breakdown of the time spent in each heart rate zone throughout your session. Each zone corresponds to a specific range of beats per minute (BPM) and is designed to represent different levels of exertion, from light to very intense. The zones are personalized according to your age and fitness level.
Heart Rate Details
This section displays the Most Active Heart Rate Zone, Average, Maximum and Minimum Heart Rate over the Session.
Difficulty
Difficulty, also known as the Rate of Perceived Exertion (RPE), is a personal score that captures the intensity of your workout on a scale from 1 to 10. By logging this post-session, you reflect your personal assessment of effort.
Workload
Shows the stress felt by the athletes body during a session, derived from duration, difficulty, and heart rate.
Movement
The ORB Sport Smart Mouthguard gauges the responsiveness and mobility of your movements. Movement is represented as a percentage to indicate high, medium, or low intensity. Using your height, we estimate the distance travelled by calculating your stride length and steps taken.
Movement Intensity
Movement Intensity amplifies and highlights periods of high activity, making them stand out against lower activity periods. It shows the athletes mobility level at any given moment, normalized between 0 and 1.
Average Movement Intensity
Taken from the graph above, an average is given based on the athletes entire session, between 0 and 1.
Movement Intensity Zones
Movement Intensity Zones shows the percentage of time the athletes spent at high, medium and low intensity.
Distance
Steps Chart
This chart shows the number of steps taken throughout a session. It visually tracks your step count over time, providing a moment-to moment look at your activity level and helps illustrate periods of higher and lower physical movement.
Distance Details
This section shows the Total Steps you took over your Session and an estimate of the distance you traveled.
Impacts
The ORB Sport Smart Mouthguard tracks total linear g-force in three dimensions (x, y, z) to present clear impact data. This data is broken down to show the g-force recorded on each side of the head.
Linear Resultant G-Force Graph
The graph shows the linear G-force experienced during the session. The graph shows aggregates forces from all three axes, X, Y, and Z, to give an overview of the impacts sustained.
Impact Region
Impact Region displays the percentage of impacts detected by the mouthguard on the left side versus the right side of the head.
Impact Region Difference
This parameter indicates the difference in the percentage of impacts felt between the left and right sides.